As a motor control engineer, how would you apply computational and analytical techniques to devise a strategy preventing high current in the lower speed range of a motor, specifically in relation to minimum voltage boosting?
Description
In this assignment, you will work through several tasks within the study of the Electric Drives module to perform calculations and simulations in MATLAB/Simulink. You are expected to compare your results with the laboratory data provided in the below section and complete the tasks as appropriate.
Introduction
The torque of an asynchronous motor is a result of the interaction of flux and rotor flux.
At a rated frequency, if the voltage is set to a certain value and only reduces the frequency, then there will be a large magnetic flux and magnetic circuit saturation (severely, it will burn the motor). Therefore, the frequency and voltage must be changed proportionally. When changing the frequency, the output voltage of the AC drive should be controlled, to keep constant flux and avoid weak magnetic and magnetic saturation phenomena. The AC induction motor is somewhat more complex, to overcome its poor transient behavior.
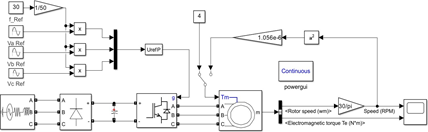
Fig.1. Circuit diagram
Referring to the circuit diagram in Fig. 1, you are required to deliver the following tasks:
- As a motor control engineer, how would you apply computational and analytical techniques to devise a strategy preventing high current in the lower speed range of a motor, specifically in relation to minimum voltage boosting? Discuss the limitations associated with the techniques employed. Support your answer from the technical literature.
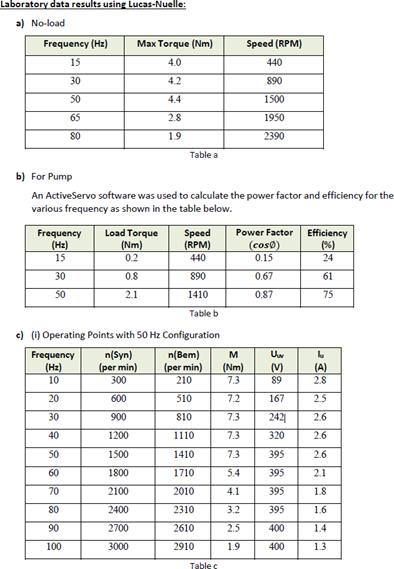
- Perform and describe the simulation model in MATLAB/Simulink software you would employ to obtain the speed/torque characteristics of a motor using the altered V/f characteristics at frequencies of 15, 30, 50, 65, and 80 Hz, based on the experimental setup in Fig. 1. Discuss the results.
- In the context of the simulation in Fig. 1, how would you select and apply equipment and engineering technologies to obtain the speed/torque characteristics of the pump/ventilator at frequencies of 15, 30, and 50 Hz for both V/f and V/f2 characteristics? Discuss the results and the limitations of the chosen technologies.
- From the data on the motor nameplate given in Fig. 2 and ignoring core, friction, windage, and stray losses, plot a torque-speed curve, and output power-speed curve for this motor, at rated terminal voltage and frequency.
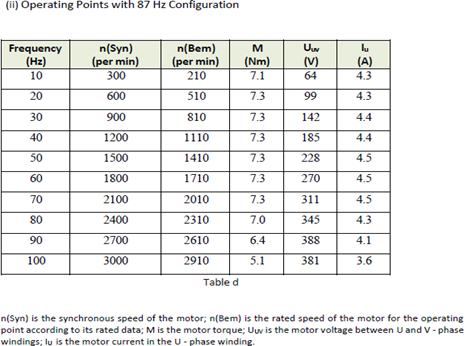
- Determine the torque, voltage, and current in the phase winding U for various frequencies in both standard and 87 Hz configurations under torque control. By using the appropriate software packages (MATLAB or Excel) to plot the graphs, analyse and explain, how measured torque and currents respond in operating points for the standard connection and 87 Hz configuration with a maximum corner frequency of 50 Hz. Evaluate the advantages and disadvantages of the 87 Hz method for actual industrial use, considering the complexities and uncertainties involved.
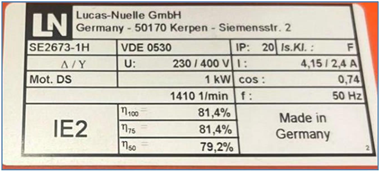
Fig. 2. Motor nameplate
Report Structure
The report should adhere to the following guidance:
- The report should have a title page and contents page, and each page should be numbered.
- Aside from the title and contents pages, the report should be 2000 words or equivalent in length.
- One additional page may be used to list references – which should follow the university standard.
- Figures and tables should be numbered and should have a caption describing the figure/table. The caption should also indicate the primary feature that should be observed by viewing the figure/table. Figures should also be neat and of a readable size.
Brevity is commendable. Appendices should be used for additional information such as extracts from data sheets. It is important that the report be readable and understandable without reference to the appendices.
Marking Scheme
The report should describe the V/f control in both constant flux and field weakening regions and compare the expected theoretical results or system response to the simulation outcomes. In doing so a suitable understanding of how a V/f control architecture operates within a VSD system can be demonstrated.
Assessment will be based on Standard University Level 6 Criteria. Marks will be awarded based on:
Structure: Clearly structured report with appropriate use of tables, graphs, diagrams, and subsections. [10 marks]
Literature Review: Effective review of literature resources such as textbooks and journal articles to build the foundation for the experiments presented in the report. In-text citation andreferencing using appropriate referencing style. [20 marks]
Simulation/Experimental Results and their Technical Analysis: Appropriate summarization of results from simulation organised into tables and figures without duplication of data. Identification and application of appropriate metrics for comparison/evaluation of results. [40 marks]
Discussion/Conclusions: Clear discussion of findings with logical conclusions based on evidence and a competent critical analysis. Explanation of discrepancies or suggestions for improvement. [20 marks]
Presentation: Excellent layout, conforms to all technical specifications with clear expression of ideas and appropriately presented [10 marks]
Professional Skills
Apply industry standard computer simulation tools with limited supervision or direction and interpret results. Operate ethically in situations of varying complexity and predictability requiring the use of power electronics in the speed control of DC and AC machines.
Learning outcomes:
The learning outcomes are:
C1. Apply knowledge of mathematics, statistics, natural science and engineering principles to the solution of complex problems. Some of the knowledge will be at the forefront of the particular subject of study.
C2. Analyse complex problems to reach substantiated conclusions using first principles of mathematics, statistics, natural science and engineering principles.
C3. Select and apply appropriate computational and analytical techniques to model complex problems, recognising the limitations of the techniques employed.
C4. Select and evaluate technical literature and other sources of information to addresscomplex problems.
C6. Apply an integrated or systems approach to the solution of complex problems.
C12. Use practical laboratory and workshop skills to investigate complex problems.
C13. Select and apply appropriate materials, equipment, engineering technologies andprocesses, recognising their limitations.
C17. Communicate effectively on complex engineering matters with technical and non- technical audiences